

SolarWinds SAM Overview
SolarWinds Server & Application Monitor (SAM) serves as an independent utility for system administration, capable of being integrated with other SolarWinds management tools. Central to its functionality is the Orion platform, which facilitates the collaboration of various monitoring features.
Key Highlights:
-
Holistic Monitoring: Monitors the physical conditions of servers alongside the network traffic from essential applications.
-
Seamless Orion Integration: Ensures smooth operation with additional SolarWinds monitoring products.
-
Scalability for Enterprises: Especially beneficial for expansive and distributed IT infrastructures.
The SAM tool meticulously observes the physical health of your servers and monitors the network activity stemming from critical applications. The term "applications" in this context refers to pivotal network services such as DHCP, DNS, and Active Directory, rather than general software installed on servers.
This monitoring solution is designed to cater to organizations of varying sizes, yet its robust WAN activity monitoring features make it particularly advantageous for large enterprises managing intricate and distributed IT frameworks.
-
Ready-to-Use Tools: Comes equipped with pre-configured dashboards, monitors, and templates suited for specific operational environments.
-
Agentless Operation: Delivers real-time monitoring without requiring agents to be installed on individual devices.
-
Auto-Discovery Functionality: Automatically identifies new devices and updates the network topology and inventory.
-
Customizable Dashboard: Features drag-and-drop widgets for personalized display of information.
-
Application Dependency Mapping: Pinpoints and illustrates application interdependencies and potential network bottlenecks.
-
Learning Curve: The range of advanced features necessitates a considerable time commitment to fully understand, which may pose challenges for newcomers.
For further details, visit the official SolarWinds website:
www.solarwinds.com/server-application-monitor/
You can also download a free 30-day trial of the Server & Application Monitor at solarwinds.com.
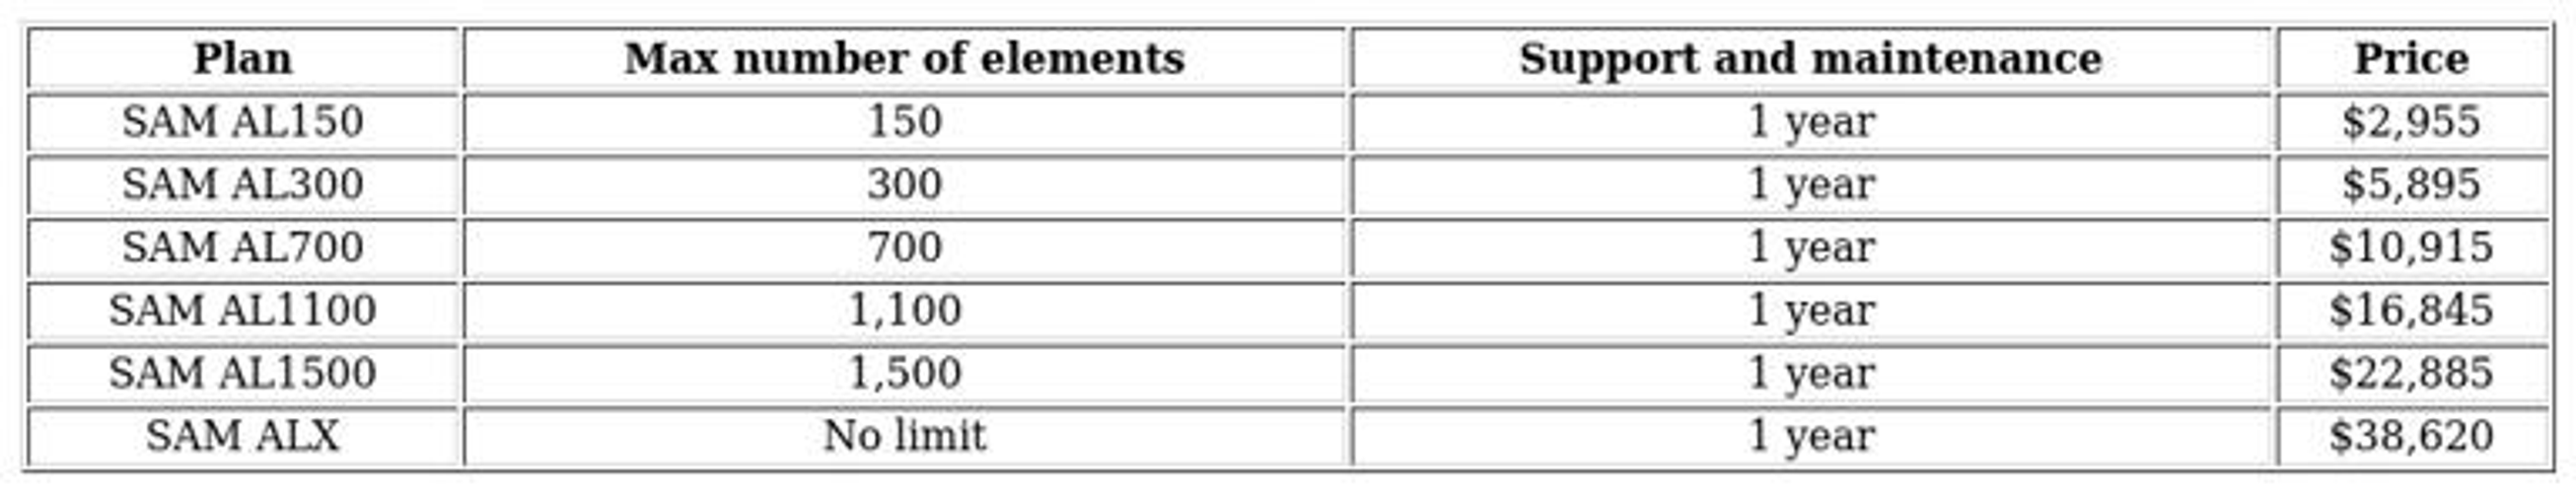
The SAM is available in six pricing tiers. Each version encompasses the same functionalities, with costs increasing in relation to the number of servers being monitored.
SolarWinds determines the pricing tiers based on a metric known as “monitors,” which meets one of the following three criteria:* Component monitoring entails tracking various server metrics, including performance counters, processes, URLs, services, and scripts.
-
A node refers to any device linked to the network, which could encompass servers, power supplies, virtual machines, ESX hosts, or printers.
-
Volume represents a logical disk within the system.
The different plans offered include:
To assess the number of monitors you'll need, exploring the online demo of the SolarWinds Server & Application Monitor is a great starting point. Additionally, you can take advantage of a 30-day free trial to evaluate how many monitors are essential for your specific setup.
When you purchase the software, you gain perpetual rights to use it; however, support and maintenance are only included for the first year. After that, annual fees apply for continued support. If you choose to forgo this option, you can find assistance through community forums on the SolarWinds website, where fellow users share insights and solutions. Regular updates and patches are vital for addressing newly identified security vulnerabilities, so it's crucial to keep your software current.
The installation of the SolarWinds Server & Application Monitor is limited to Windows operating systems. Nevertheless, it’s capable of monitoring a wide array of servers across various vendors and operating systems. The hardware monitored by this system includes essential services like racks, power supplies, and temperature management. Key supported hardware types are:
- IBM eServer xSeries
- Dell PowerEdge servers
- Dell PowerEdge blade racks
- HP ProLiant servers
- HP BladeSystem enclosures
- VMware vSphere Hypervisor
SolarWinds SAM monitors several physical server metrics, such as hard drive capacity and usage, CPU performance, and the status of arrays, fans, and power supplies.
In terms of operating systems, the monitor is compatible with:
- Microsoft Windows Server
- Linux
- Solaris
- Unix
- HP-UX
The SolarWinds monitoring solution can track over 1,200 different applications, categorized into areas like:
- Application servers
- Authentication servers
- Web servers
- Web services
- Collaboration systems
- CRM systems
- Database servers
- DHCP servers
- Directory servers
- ERP systems
- Infrastructure managers
- Virtualization environments
- Mail servers
- Security applications
Application monitoring is facilitated through templates, allowing for the creation of custom templates to observe applications not included in the default options. This feature also supports tracking homegrown applications, ensuring comprehensive oversight of your IT environment.The SolarWinds platform empowers users to create custom scripts tailored to their specific needs.
These scripts enable the configuration of complex alert parameters and define the actions to take when those alerts trigger.
If you've previously utilized a Nagios-based monitoring system, you have the option to import your existing Nagios scripts and modify them for compatibility with SolarWinds.
Included with the Server and Application Monitor are over 1,000 pre-built action scripts known as "templates."
This monitoring tool's capabilities extend to cloud environments, allowing oversight of activities within your Amazon AWS accounts and the integration of Microsoft Azure services into the monitoring framework.
You can effectively track interactions across various resources, encompassing cloud solutions, data centers, remote site activities, and local network and virtual services.
A standout feature of the Server and Application Monitor is the AppStack functionality.
This allows users to visualize the foundational services and infrastructure that support each application, facilitating quick identification of performance issues.
Understanding the relationships between the software applications in use and the resources that support them is crucial for both troubleshooting and preventing potential crises.
Within the AppStack interface, each application is represented as a symbol, with corresponding service levels displayed underneath.
The color-coded elements on the stack provide immediate visual cues, making it easy to identify and address any issues.
When you integrate a virtual environment into your network, it can be effectively monitored using the Server and Application Monitor.
SolarWinds SAM is capable of analyzing the performance of various platforms, including:
-
VMware ESXi
-
Microsoft Hyper-V
With its built-in virtual environment monitoring capabilities, the Server and Application Monitor provides a comprehensive overview of your virtual machine systems.
The SolarWinds Server & Application Monitor has a limitation when it comes to analyzing activities within virtual environments.
For organizations with a large-scale virtual machine setup, incorporating the SolarWinds Virtualization Manager may be necessary, as it works seamlessly with the Server and Application Monitor.
Upon initial installation, the system reaches out to your networked servers to curate a comprehensive inventory of the applications that are operational on them.
This inventorying is not a one-time event; it continuously operates as a fundamental aspect of the monitoring capabilities.
Moreover, the discovery mechanism goes beyond merely cataloging servers and applications; it also evaluates their interdependencies. This analysis helps to create a clearer understanding of performance issues or failures, which can be visualized on the dashboard.
SolarWinds Server & Application Monitor
The AppInsight feature within the Server & Application Monitor enables users to gain enhanced visibility into specific applications.
However, it's important to note that this functionality is limited to monitoring Microsoft Exchange Servers, Microsoft Internet Information Services, and Microsoft SQL Servers exclusively.
The PerfStack feature within the SolarWinds monitoring suite allows users to create a customized metrics page by simply dragging and dropping various elements from the dashboard. This functionality is particularly beneficial for pinpointing critical performance challenges affecting essential applications.
SolarWinds Server & Application Monitor is exclusively designed for the Windows operating system. It's compatible with Windows Server 2012 and 2016, but only in the English, Japanese, German, or Simplified Chinese language variants. Additionally, you must have Microsoft Internet Information Services (IIS) version 8.0 or higher and .NET Framework version 4.6.2 installed on your server.
The installation of the Server & Application Monitor software requires two distinct components: the core system software and a supporting database. This means you will need at least two Windows servers to deploy SolarWinds SAM. Importantly, if you operate a WAN, ensure that both components are located on the same physical site to avoid complications. It's also crucial to note that neither component can be placed on servers hosting Microsoft SharePoint, Microsoft Exchange, or Research in Motion applications, necessitating separate servers for those services if they are in use.
For the database aspect, you will need one of the following SQL Server versions: 2012, 2014, 2016, or 2017.
Regardless of the version of Server & Application Monitor you choose, your hardware must include quad-core processors or higher, in addition to two 146 GB 15K RPM hard drives.
As the service plans from SolarWinds scale up, so do the physical requirements for your system. The six service plans are categorized based on network size: the AL150 and AL300 plans cater to small networks, while the AL700 and AL1100 plans are tailored for medium-sized networks. For large networks, the options are the AL1500 or ALX plans.
Here are the server requirements based on network size for the main monitoring software:
-
For small networks, allocate a server with 6 GB to 8 GB of available RAM, with the application occupying between 10 GB and 20 GB of disk space.
-
Medium networks should have servers with 8 GB to 16 GB of RAM and 15 GB to 40 GB of disk storage.
-
Large networks require servers equipped with 16 GB to 32 GB of RAM, and the application will need between 30 GB and 100 GB of disk space.To effectively utilize the database component of the monitoring solution, specific hardware requirements must be satisfied based on the size of the network:
-
For small networks, a database server should have between 4 GB and 8 GB of RAM for the AL150 system, while the AL300 requires 8 GB to 16 GB. Additionally, ensure there is 20 GB to 40 GB of disk storage available.
-
Medium networks necessitate a server with 16 GB to 64 GB of RAM and 50 GB to 100 GB of disk space.
-
Large networks will demand a more robust setup, requiring 64 GB to 128 GB of memory and 100 GB to 400 GB of disk capacity for the monitoring database.
As highlighted previously, the Server & Application Monitor (SAM) operates on the SolarWinds Orion application framework, facilitating seamless integration with other SolarWinds infrastructure management tools. The primary focus of these monitoring solutions is the performance status of network devices. Additional Orion-based SolarWinds tools include:
-
SolarWinds Network Performance Monitor (available for a free trial)
-
SolarWinds NetFlow Traffic Analyzer (available for a free trial)
-
SolarWinds Network Configuration Manager (available for a free trial)
-
SolarWinds Virtualization Manager (available for a free trial)
-
SolarWinds Storage Resource Monitor (for more details)
The Server & Application Monitor is particularly powerful when used alongside other SolarWinds products, such as the Network Performance Monitor. While it functions effectively as an independent tool, many SolarWinds suites incorporate SAM, enhancing overall monitoring capabilities.
SolarWinds provides three systems management bundles that feature the Server & Application Monitor. The first is the Hybrid Systems Monitoring Pack , which includes the Virtualization Manager , Log Analyzer , and Server Configuration Monitor in addition to SAM. This bundle delivers in-depth insights into the performance of both on-premises and cloud-based virtual servers.
The Application Performance Optimization Pack pairs the Server & Application Monitor with the SolarWinds Database Performance Analyzer, offering improved monitoring capabilities specifically for system databases.
Lastly, the Log and Systems Performance Pack merges the Server & Application Monitor with the SolarWinds Log Analyzer , providing two of the four tools found in the Hybrid Systems Monitoring Pack, thereby enhancing overall system performance monitoring.SolarWinds offers the Server & Application Monitor as an optional addition to its comprehensive Network Operations Manager suite, which also comprises the Network Performance Monitor, NetFlow Traffic Analyzer, and User Device Tracker.
You can take advantage of a 30-day free trial to explore the full capabilities of the systems management bundle.
This powerful tool is designed primarily for larger enterprises, though it is also compatible with smaller networks. The Server & Application Monitor, along with all its bundled products, can be downloaded for a trial period of 30 days at no cost, allowing users to evaluate its features without any financial commitment.
The SolarWinds Server & Application Monitor is an on-premises solution that effectively tracks and analyzes the intricate relationships between various software applications, services, and the servers that host them. It excels in identifying dependencies and mapping them out, which facilitates quick root cause analysis when user-facing systems experience performance issues. Notably, this tool can monitor cloud-based applications, illustrating how software operates across different servers and locations.
The SolarWinds platform is anchored by its Orion base server, which enhances efficiency for businesses that opt for multiple monitoring modules. Typically, organizations begin their journey with the Network Performance Monitor and subsequently expand their toolkit by incorporating additional modules, such as the Network Configuration Manager or the NetFlow Traffic Analyzer.
As a leading provider of system monitoring and management solutions, SolarWinds delivers a robust suite of tools, including the Server & Application Monitor designed specifically for application performance monitoring.
What is a Netflix VPN and How to Get One
A Netflix VPN is a virtual private network that enables users to access region-restricted content on Netflix by connecting to servers in various countries. This service is particularly useful for those who want to explore a broader range of shows and movies that may not be available in their current location. By selecting a reliable VPN provider that supports streaming, users can easily connect to a server in their desired region and enjoy an expanded Netflix library.
Why Choose SafeShell as Your Netflix VPN?
If you're looking to access region-restricted content by using a Netflix VPN, you may want to consider the SafeShell VPN . SafeShell VPN offers a range of benefits that make it an excellent choice for streaming Netflix. One of the main advantages is its high-speed servers that are specifically optimized for seamless Netflix streaming, ensuring you can enjoy your favorite shows and movies without any interruptions. These servers are equipped with cutting-edge technology, providing lightning-fast connection speeds for buffer-free playback and high-definition streaming.
Moreover, SafeShell VPN allows you to connect multiple devices at once, supporting up to five devices simultaneously across various operating systems such as Windows, macOS, iOS, Android, and more. Its exclusive App Mode feature enables you to unlock and enjoy content from multiple regions at the same time, giving you the freedom to explore a diverse range of streaming services. With lightning-fast speeds and no bandwidth limitations, you can say goodbye to buffering and throttling. Additionally, SafeShell VPN prioritizes your online privacy with its proprietary ShellGuard VPN protocol, ensuring top-level security for your private browsing sessions. This makes SafeShell VPN a reliable solution, particularly when you find your netflix vpn not working due to outdated software.
A Step-by-Step Guide to Watch Netflix with SafeShell VPN
To enjoy Netflix content from different regions using SafeShell Netflix VPN , start with subscribing to the service. Visit the SafeShell VPN website and choose a plan that best suits your needs and budget. After selecting your plan, click on the "Subscribe Now" button to complete the subscription process. Next, download and install the SafeShell VPN on your device by navigating to the website and selecting the appropriate version for your operating system, whether it's Windows, macOS, iOS, or Android. Once installed, launch the SafeShell VPN app and log in to your account.
SafeShell VPN offers two modes, but for an enhanced Netflix streaming experience, it is recommended to select the APP mode. After logging in, browse the list of available servers within the app. Choose a server located in the region whose Netflix content you wish to access, such as the US, UK, or Canada, and click "Connect" to establish a secure connection. Once connected, open the Netflix app or visit the Netflix website, log in with your account, and start enjoying the extensive library of content available in the region you selected through SafeShell Netflix VPN.
