

sFlow: Advanced Traffic Monitoring
sFlow: A Comprehensive Network Traffic Monitoring Solution
sFlow represents an innovative approach to network monitoring, offering real-time visibility into traffic patterns without overwhelming system resources. By implementing a sampling methodology rather than capturing every packet, sFlow provides an efficient way to monitor high-speed networks while maintaining accuracy in traffic analysis.
The Origins and Evolution
Developed in the late 1990s by InMon Corporation, sFlow was designed as a scalable alternative to traditional monitoring protocols. The standard was formalized in 2001 with RFC 3176, establishing the framework for sFlow datagrams and sampling methodologies. Unlike proprietary solutions such as Cisco's NetFlow, sFlow is maintained by an independent non-profit organization with input from various network equipment manufacturers, ensuring broad compatibility across platforms.
How sFlow Works
The fundamental principle behind sFlow is strategic sampling. Rather than capturing every packet traversing the network, sFlow collects representative samples at administrator-defined intervals. This approach significantly reduces storage requirements and processing overhead while still providing statistically accurate traffic insights.
For example, if an application generates 50% of network traffic, this pattern will be evident whether sampling every packet or every hundredth packet. This efficiency makes sFlow particularly valuable for high-speed networks where complete packet capture would be impractical.
Beyond packet sampling, sFlow also collects counter data and statistical information from network devices. Version 5 expanded capabilities to include host and application data, creating a more comprehensive monitoring solution.
Key Benefits of sFlow Monitoring
• Reduced resource utilization compared to full packet capture
• Scalability across diverse network environments
• Support for high-speed networks
• Vendor-neutral implementation
• Ability to identify traffic patterns and anomalies
• Valuable insights for capacity planning and troubleshooting
Essential Features in sFlow Analyzers
When evaluating sFlow collection and analysis tools, organizations should consider:
• Ease of deployment and configuration
• Adjustable sampling rate settings
• Customizable data retention policies
• Filtering capabilities by IP, protocol, and other attributes
• Analytical tools for trend identification
• Integration with remediation systems
• Compatibility with other monitoring protocols (NetFlow, IPFIX, etc.)
sFlow provides the visibility needed for effective network management, especially as networks grow in complexity. By offering insights into traffic patterns, potential bottlenecks, and security anomalies, sFlow tools enable administrators to maintain optimal network performance while planning for future growth.
For organizations managing complex network infrastructures, implementing a robust sFlow monitoring solution represents a critical component of their overall network management strategy, providing the intelligence needed to keep systems running efficiently and securely.
sFlow is a widely recognized, non-proprietary protocol, utilized across a broad spectrum of network devices from various manufacturers. It is designed to be vendor-agnostic, enabling seamless integration and communication with more than 200 different vendors' equipment.
In addition to sFlow, the Site24x7 network monitoring service supports other popular flow protocols such as NetFlow, J-Flow, IPFIX, NetStream, AppFlow, and CFlow. This versatility makes it an ideal solution for multi-vendor environments where diverse networking technologies are in use.
Site24x7's comprehensive monitoring capabilities extend to both on-premises and cloud-based resources. This allows for the consolidation of monitoring activities across multiple sites into a single, unified platform. By blending these monitoring functions, Site24x7 provides a cohesive view of network performance and traffic, regardless of the location or type of infrastructure.
Network analytics powered by sFlow technology enable granular visibility into data flows,
transforming raw metrics into actionable insights. Administrators configure custom alert rules
that trigger SMS, email, or voice notifications when traffic patterns exceed defined thresholds,
ensuring rapid response to anomalies without manual oversight.
sFlow's packet sampling mechanism allows dissection of traffic by application protocols,
geolocations, or device pairs, revealing hidden communication patterns. This depth enables
technicians to reconstruct specific dialogues between endpoints, identifying irregular data exchanges
that might indicate security breaches or misconfigured services.
Bandwidth utilization trends become clear through dynamic flow visualizations that chart
usage spikes across hours, days, or seasons. These heatmaps expose recurring congestion events,
enabling predictive capacity planning rather than reactive troubleshooting.
By automating baseline monitoring through sFlow-collected metrics, IT teams shift focus
from constant surveillance to strategic optimization. Real-time dashboards serve as early warning systems,
while historical flow data provides forensic evidence for post-incident analysis and infrastructure audits.
Ideal for growing enterprises, Site24x7 combines sFlow analytics with full-stack monitoring in scalable subscription bundles
Its cloud-native platform supports over 200 device types while unifying network performance, server health, and application diagnostics
Unique MSP-focused tier enables centralized management for client networks across multiple tenants
The system's mobile apps deliver real-time visibility into latency patterns and traffic bottlenecks across hybrid infrastructures
While feature-rich, new users may require ramp-up time to leverage advanced customization and automated alert configurations
Flexible pricing accommodates SMBs with entry-level tiers while offering capacity upgrades for enterprise deployments
Paessler PRTG stands out with its modular sensor architecture, allowing granular monitoring of sFlow, NetFlow, and IPFIX streams
The free tier's 100-sensor limit after trial period suits small networks, with each interface/parameter tracked as discrete sensors
Custom dashboard creation and hybrid deployment options complement its protocol-agnostic traffic analysis capabilities
Both solutions offer 30-day trials, enabling organizations to evaluate sFlow visualization alongside infrastructure monitoring needs
Site24x7 excels in cloud-first environments, while PRTG provides deeper control for on-premises network observability requirements
Integration with adjacent monitoring domains (logs, configurations, web apps) positions these tools as holistic infrastructure guardians
sFlow Technology Overview
Understanding sFlow Technology and Analysis Tools
Network monitoring is essential for maintaining optimal performance across infrastructure of all sizes. sFlow (Sampled Flow) represents a key technology in this domain, providing valuable traffic insights through packet sampling techniques.
The sFlow protocol operates by collecting packet header information rather than entire data streams, significantly reducing storage requirements while enabling comprehensive traffic analysis. This sampling approach makes sFlow particularly effective for high-speed networks where complete packet capture would be impractical.
When implementing sFlow monitoring, organizations have several powerful analyzer options available. These tools transform raw sFlow data into actionable intelligence through intuitive visualizations and reporting capabilities.
Modern sFlow analyzers typically feature customizable dashboards with interactive mapping functionality, allowing network administrators to quickly identify traffic patterns and potential issues. Many solutions provide both predefined reports for common scenarios and tools for creating tailored analyses based on specific organizational needs.
Most enterprise-grade monitoring platforms support multiple flow protocols beyond sFlow, including NetFlow, IPFIX, J-Flow, and NetStream. This protocol flexibility ensures compatibility across diverse network environments while providing a unified analysis interface.
Key evaluation criteria when selecting an sFlow analyzer include:
-
Installation complexity and available setup assistance
-
Licensing model scalability as network monitoring needs expand
-
Auto-discovery capabilities for network devices
-
Root cause analysis functionality for troubleshooting
-
Alert mechanisms for traffic anomalies and threshold violations
-
Long-term data storage efficiency for historical analysis
Before committing to a specific solution, organizations should leverage available trial periods to assess platform usability and ensure the analyzer meets their specific monitoring requirements.
The monitoring system maintains a comprehensive database of collected network information, which is accessible through the console's dashboard interface. Users can select specific time periods for analysis and utilize query tools to extract valuable insights. This analytical capability enables network administrators to forecast future network capacity needs based on historical trends.
NFA includes a robust notification system that triggers alerts when predefined network conditions are detected. Alert configuration is highly customizable, allowing administrators to set notifications based on various network traffic parameters including:
• Volume fluctuations
• Event frequency
• Detection of specific traffic types
• Duration of events
• Deviations from established baselines
• Custom combinations of multiple parameters
This proactive monitoring approach helps teams address potential issues before they impact network performance.
The Comprehensive Network Traffic Monitoring Dashboard
Network monitoring solutions typically feature robust alerting mechanisms integrated directly into their dashboards. These alerts are simultaneously displayed on the main interface while being forwarded to technical staff through multiple communication channels including email notifications and SMS messages for immediate attention.
Most enterprise-grade monitoring systems implement their dashboards as intranet websites, providing secure access across the organization. A significant advantage of modern monitoring platforms is their customization capabilities - allowing teams to associate specific data visualization widgets with different data sources. This flexibility means the default layouts can be completely transformed to match your organization's specific monitoring requirements.
For larger enterprises seeking comprehensive monitoring solutions, premium options exist that offer unlimited device monitoring for a fixed subscription fee. While these solutions represent higher initial investments, they often provide better value for organizations with extensive network infrastructure.
Key Capabilities of Premium Monitoring Solutions:
-
Real-time network traffic visualization and analysis
-
Dedicated performance monitoring modules for network devices
-
Advanced capacity planning functionality
-
Multi-protocol support including sFlow, NetFlow, IPFIX, NetStream and J-Flow
-
Web-based customizable dashboards
-
Linux-based deployment options (Ubuntu, CentOS, RHEL)
For organizations seeking more cost-effective solutions, several monitoring platforms offer free or entry-level versions with reasonable capabilities. These typically limit the number of monitored devices (often around five switches/routers or hosts) and restrict historical data retention (commonly to one hour of history stored in RAM).
Professional versions remove these limitations, allowing unlimited device monitoring and extended historical data storage to disk. Many of these tools are implemented using Java technology, providing both native application interfaces and web-based access options. Comprehensive documentation typically includes configuration guides with step-by-step instructions for proper setup.
Essential Features of Standard Monitoring Solutions:
-
Detailed protocol summaries and granular analysis
-
User-defined alert thresholds
-
Free tier availability for testing and small deployments
-
Cross-platform support (Windows, Linux, macOS)
-
Network topology mapping
-
Bandwidth utilization analysis by application, user, and subnet
sFlow Monitoring Overview
The network tab in sFlowTrend offers a comprehensive look at performance statistics, including summaries and detailed traffic data at both the network and device levels. You have the ability to set up thresholds to get alerts whenever there's an unusual spike in network traffic or errors.
For a deeper dive into what might be causing a traffic anomaly, such as when a threshold is breached, you can head over to the Network > Root Cause tab. This section allows for a thorough investigation of the underlying issues.
On the dashboard, you'll find a high-level view of the monitored network and its hosts. It highlights top-level thresholds and points out any interfaces that might be experiencing errors, giving you a quick snapshot of the network's current state.
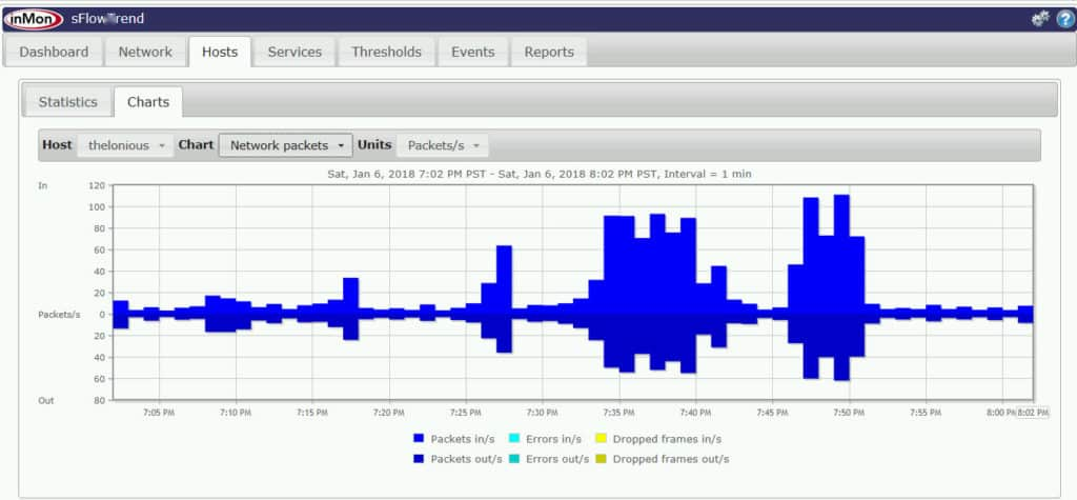
The Hosts tab is where you can access both tabular and graphical performance data for servers, including virtual ones, that are exporting sFlow data. This information covers various aspects like network, CPU, and disk usage, providing a clear picture of each server's performance.
Lastly, the Services tab presents performance metrics for applications, with a focus on those that export sFlow data. This includes a variety of web servers, offering insights into how these applications are performing within your network.
The Events Log and Reporting Capabilities in Network Monitoring Tools
Network monitoring solutions typically include comprehensive event logging functionality to track threshold violations and system errors. Many platforms offer both pre-configured and customizable reporting options, allowing users to generate and view detailed analysis of their network performance.
For smaller organizations with sFlow-enabled infrastructure, lightweight monitoring tools can provide sufficient visibility without overwhelming complexity. These free or freemium options deliver essential monitoring capabilities that satisfy the needs of small business environments, though they naturally lack some advanced features found in enterprise-grade solutions.
Considerations When Selecting an sFlow Monitoring Solution
When implementing an sFlow monitoring system, it's crucial to first verify sFlow support across your network devices, as compatibility varies by manufacturer and model. Budget-friendly monitoring options often feature:
• Straightforward threshold-based alerting systems
• User-friendly visualization tools suitable for NOC displays
• Basic reporting capabilities
However, these more affordable solutions typically have limitations including:
• Restricted reporting depth and customization
• Limited integration with external notification systems
Enterprise-Grade sFlow Monitoring Options
More comprehensive commercial solutions provide extensive traffic analysis capabilities, visualizing network activity by application, conversation, protocol, and other parameters. These platforms typically offer:
• Web-based dashboards with heat maps and real-time charts
• Comprehensive security anomaly detection
• Support for multiple flow protocols beyond sFlow
• Traffic shaping and bandwidth management tools
On-premises deployment options are available for organizations with specific security or compliance requirements. Some solutions operate independently, while others require additional software components as part of a broader network management ecosystem.
The ntopng platform offers enterprise-grade network visibility through flow data conversion and packet capture capabilities
Its companion tool nprobe bridges protocol gaps by transforming sFlow telemetry into NetFlow-compatible formats in real-time
This dynamic translation enables comprehensive traffic analysis across hybrid network infrastructures
For traffic examination, the system provides multilayer insights from application-level protocols to device-specific metrics
Network administrators gain granular visibility into bandwidth consumption patterns and host communications
Advanced alerting mechanisms trigger notifications based on traffic anomalies, latency spikes, and packet loss thresholds
While primarily targeting large organizations, the solution offers tiered licensing with accessible entry points for SMBs
The trial version provides full functionality for 30 days before restricting monitoring to two network interfaces
Post-trial upgrades unlock unlimited scale and integration with broader network management ecosystems
Key technical capabilities include live traffic decryption, retrospective flow analysis, and deep packet inspection tools
The web interface organizes network intelligence through interactive dashboards tracking top talkers and protocol distributions
TCP performance metrics reveal retransmission rates and connection quality across network segments
Enterprise deployments benefit from hop-by-hop traffic tracing and customizable data retention policies
Though not optimized for residential use, the architecture efficiently handles high-volume data center environments
Conversion workflows ensure compatibility with Cisco ecosystems while maintaining native sFlow interpretation abilities
Network Monitoring Solutions Overview
For organizations prioritizing security and scalability, Plixer Scrutinizer® stands out with hybrid deployment flexibility—physical appliances, virtual machines, or cloud-based SaaS.
Its incident response framework integrates NetFlow/sFlow analysis with automated network discovery, mapping device inventories while monitoring performance thresholds.
Though resource-intensive (16GB RAM minimum for trials), the platform bridges traffic inspection and threat detection, appealing to enterprises needing compliance-ready forensic tools.
Shifting focus to budget-conscious solutions, ntopng and nProbe cater to smaller teams.
The open-source ntopng offers protocol versatility across Unix/macOS systems, though its enterprise-grade features require paid licensing.
nProbe’s free tier caps at 25k flows, pushing users toward subscriptions for expanded monitoring.
Both tools provide discounted/free access for educational/nonprofit entities but demand technical expertise to overcome steep learning curves.
While cost-effective, their limited support models make them better suited for environments with in-house engineering resources.
Scrutinizer: A Comprehensive Network Monitoring Solution
For organizations seeking robust traffic analysis capabilities, Scrutinizer offers remarkable scalability across environments of varying sizes. The platform delivers extensive analytical and reporting functionality, making it suitable for complex network infrastructures.
New users can access all features during the 30-day evaluation period. Following this trial, the free tier restricts collection to 10,000 flows per second, with limited data retention of five hours for raw flows and one week for summary statistics.
Upgrading to the premium version unlocks valuable capabilities including:
• Alert notifications
• Customizable dashboards
• Report personalization
• Scheduled email reporting
• Technical support access
The pricing structure varies based on your selected platform and the number of flow exporters required in your implementation.
Plixer's solution appeals to a diverse customer base by providing extensive deployment flexibility. While comprehensive in its traffic analysis capabilities, users should expect an initial learning curve to effectively navigate and customize the interface for specific metrics.
Key considerations when evaluating Scrutinizer:
• Multiple deployment options supporting operational flexibility
• Enterprise-grade architecture for large network environments
• Enhanced security monitoring features
• Higher resource requirements compared to alternatives
• Custom pricing requiring sales consultation
• More complex operation than competing solutions
For networks primarily utilizing sFlow technology, several excellent monitoring tools exist, including cost-free alternatives. Your selection should ultimately reflect your network's current size, complexity, and anticipated growth trajectory.
What is a Netflix VPN and How to Get One
A Netflix VPN is a tool that enables users to bypass geographical restrictions and access a wider range of content on the streaming platform by connecting to servers in various countries. This allows viewers to watch shows and movies that may not be available in their own region, enhancing their overall viewing experience.
Why Choose SafeShell as Your Netflix VPN?
If you're frustrated with your Netflix vpn not working , you may want to consider SafeShell VPN as your go-to solution for accessing region-restricted content. SafeShell VPN offers several impressive advantages that make it stand out from other options in the market:
-
High-speed servers specifically optimized for Netflix streaming, ensuring buffer-free playback and high-definition viewing experiences without interruptions
-
Multi-device compatibility allowing you to connect up to five devices simultaneously across various platforms including Windows, macOS, iOS, Android, and smart TVs
-
Innovative App Mode feature that uniquely enables access to content from multiple regions concurrently, expanding your entertainment options significantly
-
Unlimited bandwidth with lightning-fast connection speeds that eliminate buffering and throttling issues commonly experienced with other VPNs
-
Advanced security through the proprietary "ShellGuard" protocol that keeps your browsing activities private and protected
-
Risk-free exploration through a flexible free trial plan that lets you test all premium features before committing to a subscription
A Step-by-Step Guide to Watch Netflix with SafeShell VPN
To start using SafeShell Netflix VPN , follow these steps:
-
Subscribe to SafeShell VPN by visiting their website and selecting a plan that suits your needs. Click the "Subscribe Now" button to complete the subscription process.
-
Download and install the SafeShell VPN app from the website, choosing the version compatible with your device (Windows, macOS, iOS, Android, etc.).
-
Launch the SafeShell VPN app and log in to your account.
-
Choose the APP mode for an enhanced Netflix experience.
-
Browse the list of available servers and select a server located in the region whose Netflix content you want to access, such as the US, UK, or Canada.
-
Click on "Connect" to establish a connection to the chosen server.
-
Open the Netflix app or visit the Netflix website and log in with your Netflix account.
-
Enjoy streaming the content available in the region you selected.
